User Guide
Part I Introduction
As a comprehensive information service platform, EPS China Data integrates rich numerical data resources and powerful statistical analysis system. With 65 professional databases, EPS China Data provides various data resources and incorporates software of data analysis and processing and databases into the same platform, so that our users can enjoy one-stop service of data acquisition, analysis and processing. For your better experience of our platform, we provide you with the following guides, namely Introduction, Features, Visualization, and Analysis and Prediction, in the hope that these guides may facilitate your familiarity with our platform and thus enhance your efficiency in study and research.
I. User Login
1.1. EPS China Data Home
Enter http://olap.epsnet.com.cn in your explorer or click our platform link to load the home page.
1.2. Databases
EPS China Data offers two Login patterns, IP Login and Account Login.
For IP Login user whose IP address is granted permission, please enter our databases by clicking “Enter the Databases” on the navigator bar.
For Account Login user whose IP addresses has not been granted permission, please enter our databases with account and corresponding password on the login window after clicking “Enter the Databases” on the navigator bar.
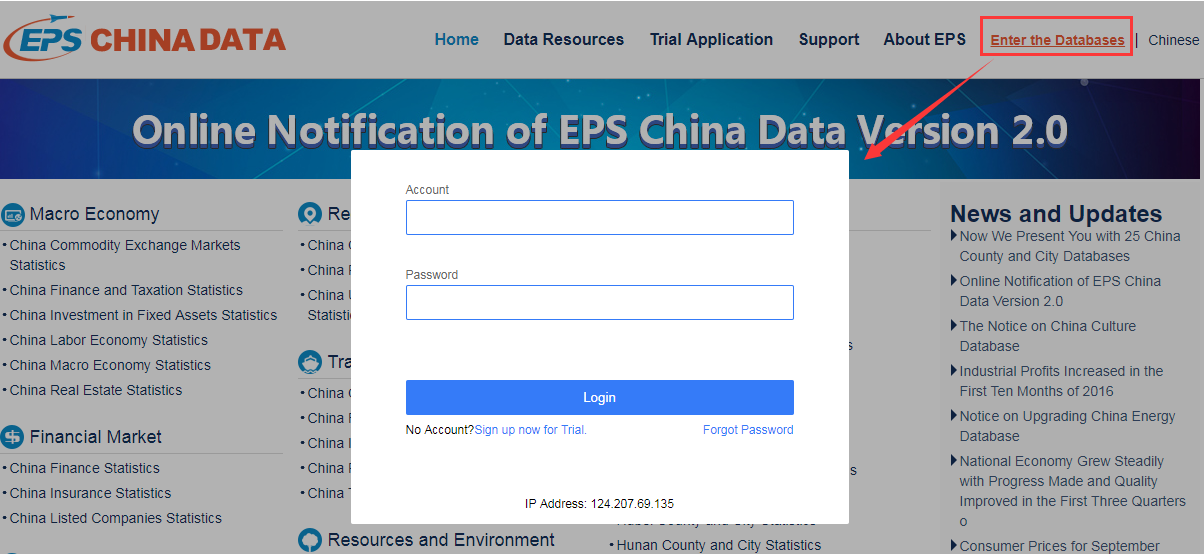
Besides, you may also enter a specific database by clicking “Enter the Databases” on the upper right of database introduction page which shall be loaded after you click the specific name of the database on home page.
1.3. My Data Center
Our platform provides My Data Center for your saving and editing data.
For IP login users,
Login window to My Data Center shall be pop up automatically when your log in with IP address and click “Favorites” and “Add Sequence”, and enter “My Data Center” and “Cloud Analytics”.

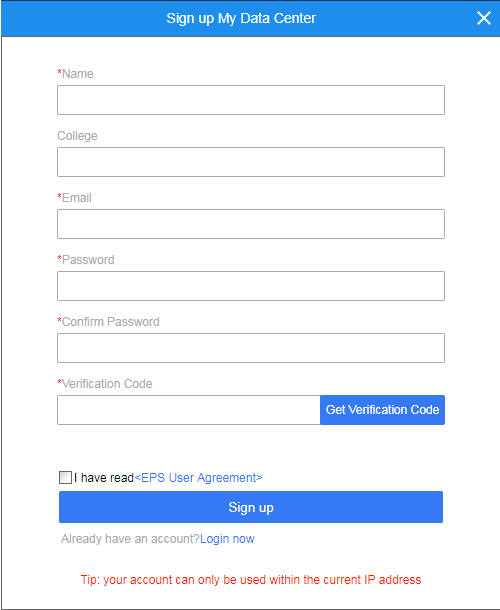
For users without My Data Center account, please apply for the registration on corresponding sites. With user name, institution, email/phone, password and certification code entered, the registration is completed.
After entering the email and password and completing personal setting, you can check and edit your data saved in My Data Center. Please note that the account is restricted to the IP range of your registration only.
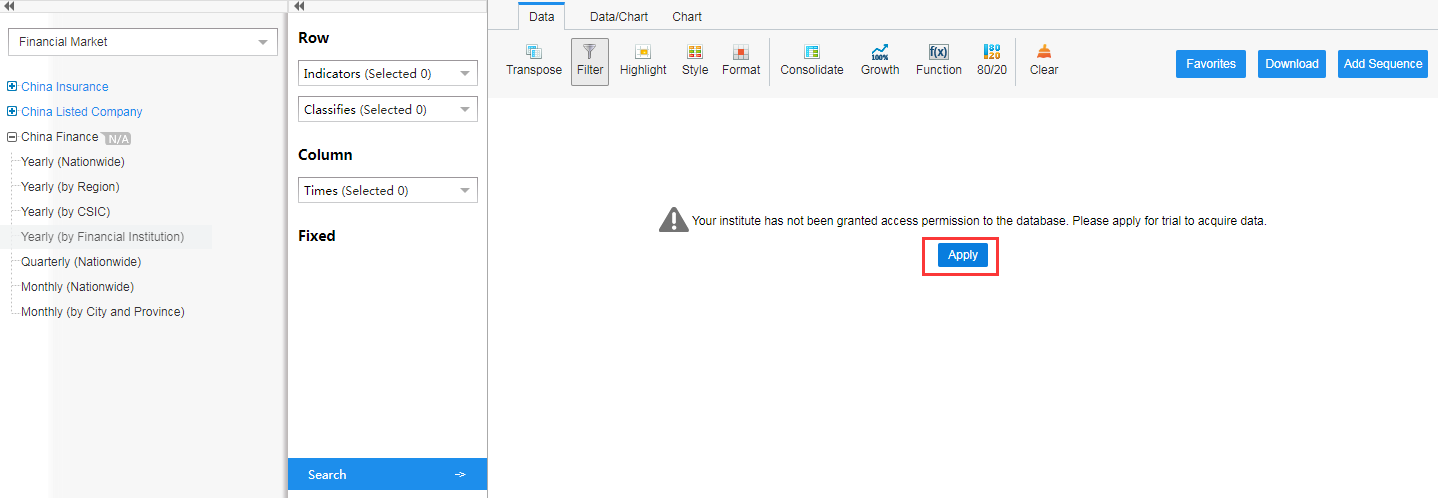
Furthermore, after you log in My Data Center, you may access the trial of databases that your institution has not been granted permission. For databases not accessible, by clicking “Apply” and log in My Data Center, you shall be granted trial access permission.
For account users, once you enter our databases, the corresponding functions shall be granted automatically.
Note: when you “Enter the Databases” on homepage or by specific databases, the system default takes the accessible databases of your institution. You may select your database cluster by the drop-down triangle as follows.
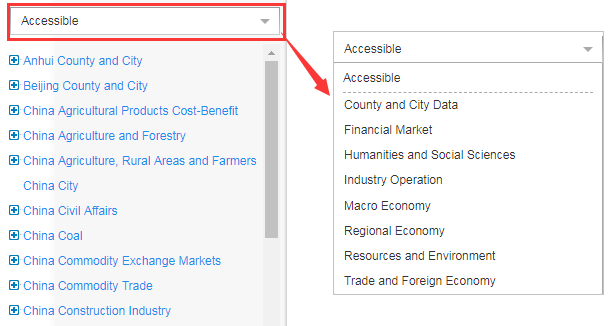
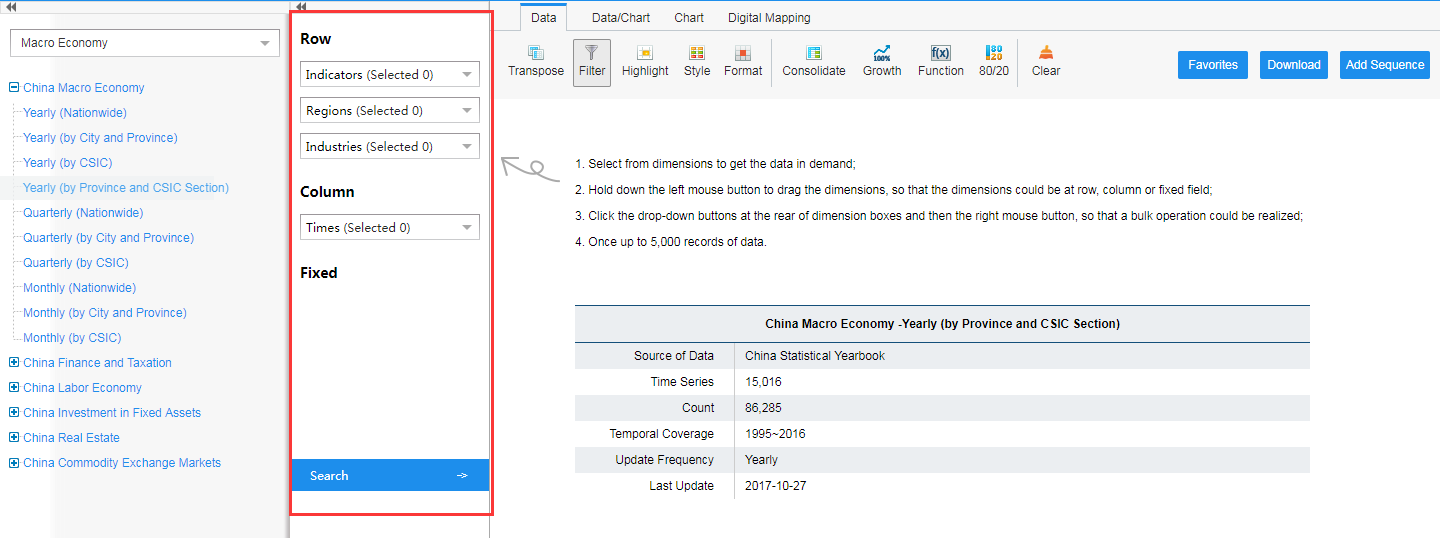
Once some sub-database is selected, the system default only takes its basic information. Indicators and other information shall be selected among dimensions, and the results would be demonstrated on the right area after clicking the button “Search”.
II. Data Search
There are two ways to search the databases, namely inter-database search and intra-database search.
2.1. Inter-database Search
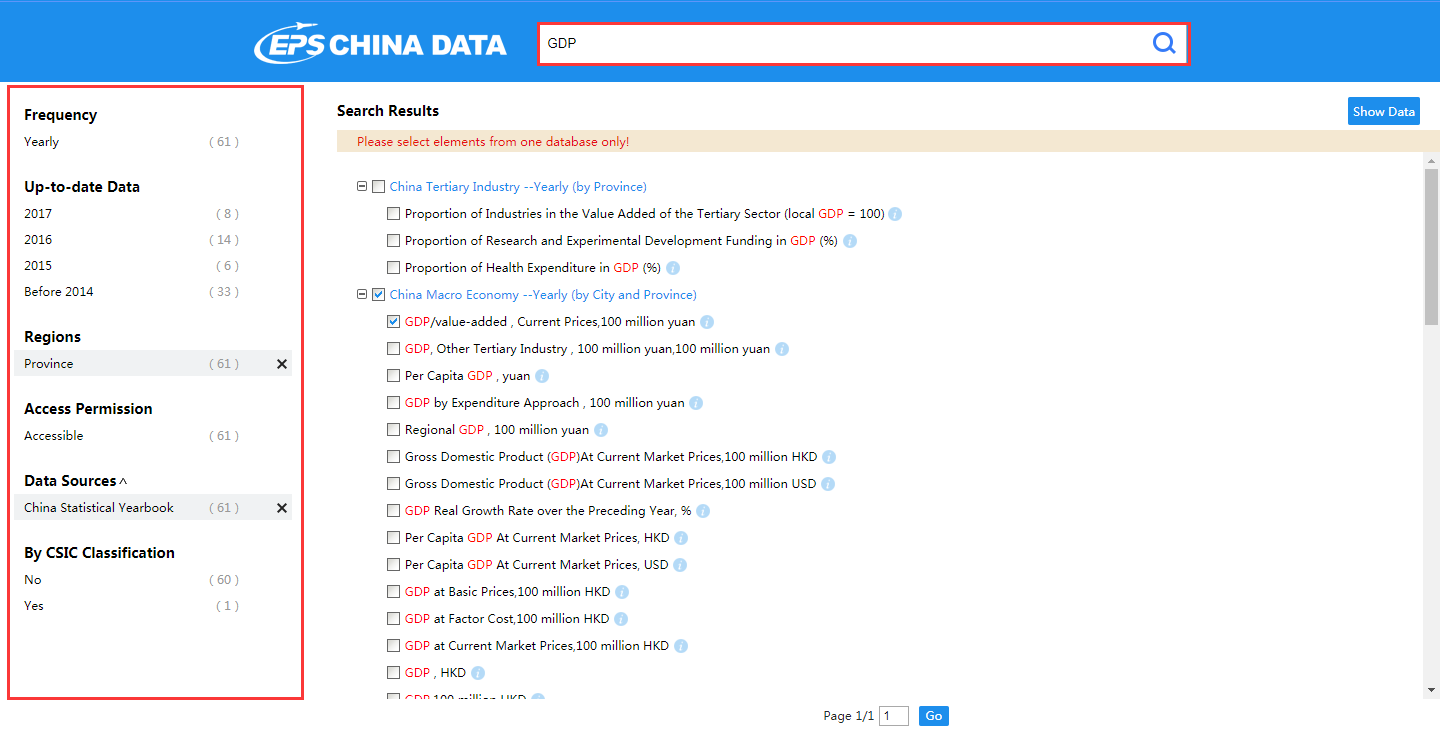
A search bar will appear on the top-right corner of the webpage after successful login. When you key in the name or keyword of the indicator, the platform will show all results that contain the keyword.
Take the example of value-added of GDP of each province in China. Keying in the keyword “GDP” in the search bar on the top-right corner, dozens of indicators containing keyword “GDP” would be returned. The options of frequencies, regions and sources will be found in the results page for quick indicator location. Since what is expected is provincial data, you may start from ticking Province from the Regions on the right part, and the corresponding data will appear. Next you may find “GDP, value-added (current prices) (100 million yuan) in “China Macro Economy—Yearly Statistics (by Province and City” and with a click on “Show Data”, the page will automatically jump to the Database page of “China Macro Economy—Yearly (by Province and City)” and show the provincial GDP data.
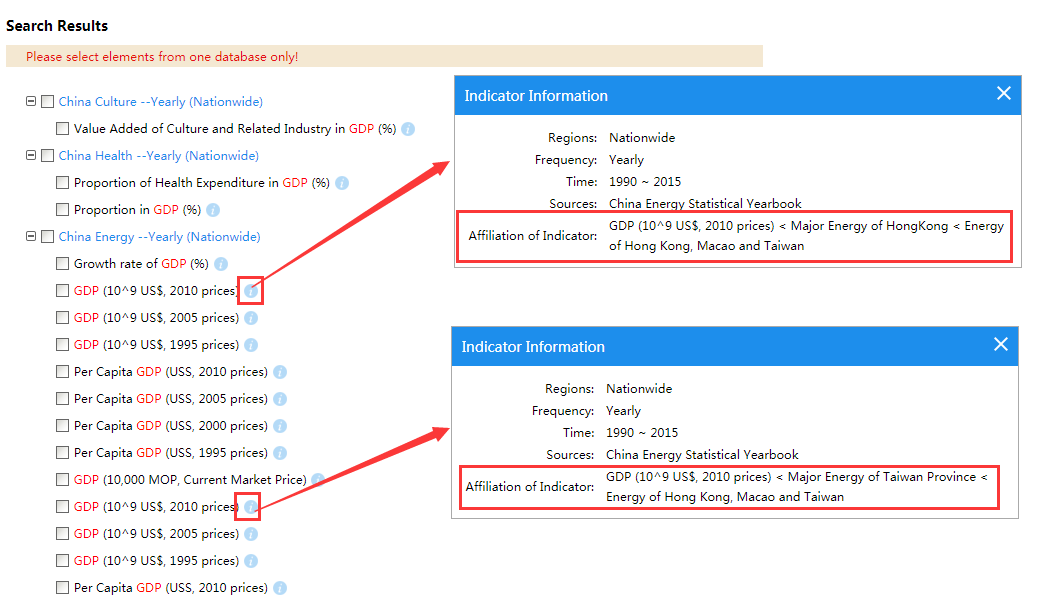
Moreover, when the exact results show up, you may acquire the detailed description of each indicator by clicking the icon, which helps to locate the indicator in demand.
2.2. Intra-database Search
After logging in EPS China Data, you can conduct indicator search in corresponding database on the left side of the interface. Still take the example of GDP of each province in China, you may find “China Macro Economy Database” on the left part first, then enter the “China Macro Economy—Yearly (by Province and City)” to look for the provincial data. Next you can conduct advanced, fuzzy search in the drop-down box of "indicator" dimension within the database by keying in "GDP" in the search box. When you click the magnifying glass search icon or press Enter, all indicators that contain the keyword will show in the drop-down box of "indicator" dimension. After ticking the indicator of "GDP, value-added (current prices) (100 million yuan)" and clicking on "Search", the data table of the indicator will show on the right area of the interface.
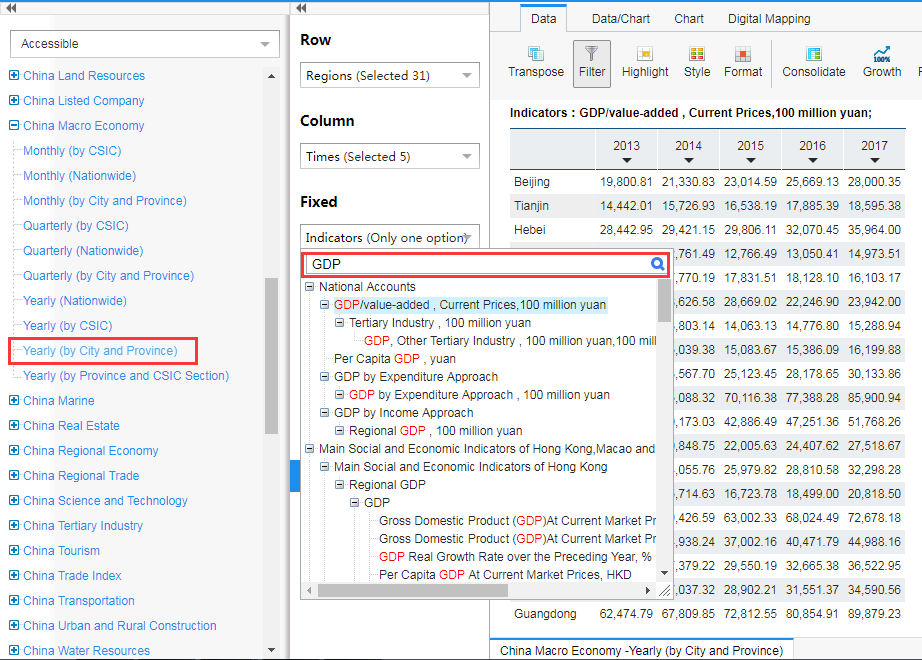
Tips: you can also right click on the combo box to use the selection shortcuts such as Select all, Deselect all, Select Siblings etc. to make selection easier.
III. Data Save and Download
3.1. Data Save
There are two data saving modes for EPS China Data: to save the query conditions and to save the query results. By data save, it means the former, while the latter is defined as “download”. For data search or retrieval, data results could only be acquired by way of setting of search conditions, and accordingly you may save search conditions for an easy recall of the search results next time.
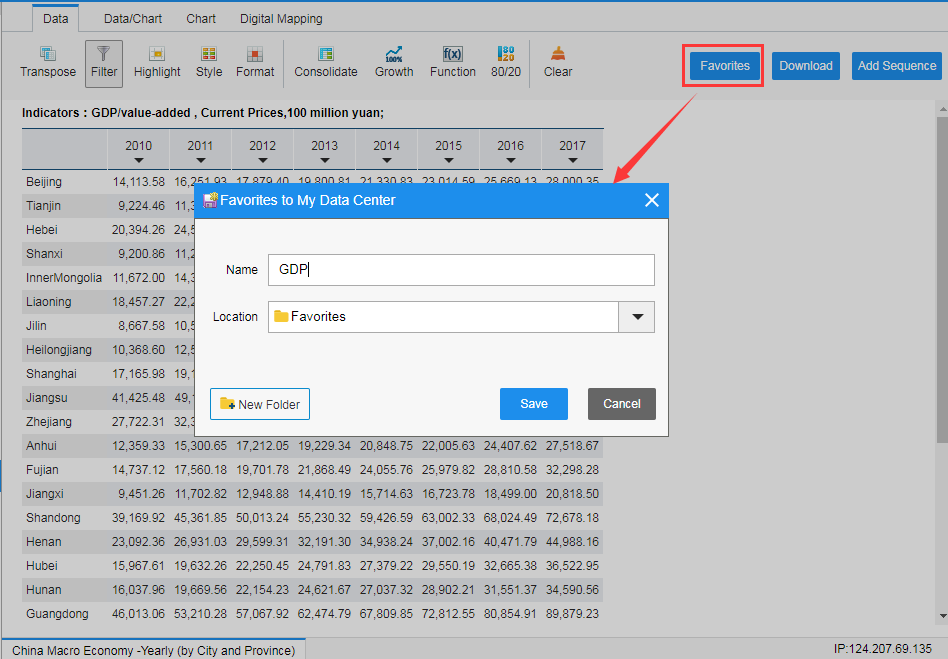
“Favorites to My Data Center” shall pop up after the click on “Favorites”, and you may name the data which need to be saved, and select the storage location. With another click on “Save”, your data is saved to Favorites.
3.2. Open the Data Saved
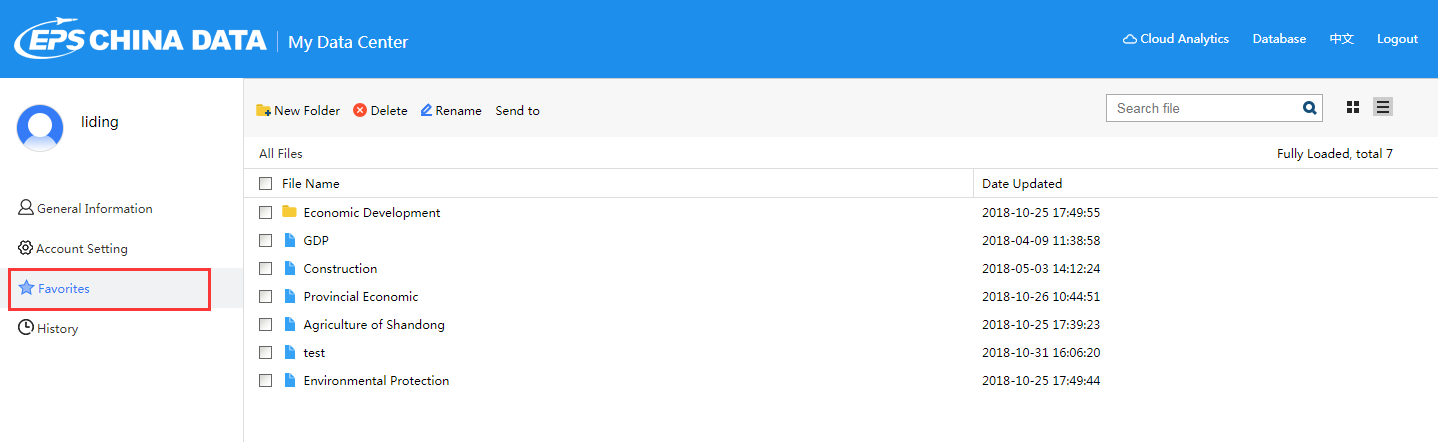
The previous search result can be recalled by clicking Favorites under My Data Center. Besides, you may edit your data already saved there.
3.3. Download
We offer multiple download methods for your convenience. Excel download format is available on the data query page, and Picture, Excel and PDF download formats on the chart and map functions.
Next Guide: Features