User Guide
Part II Features
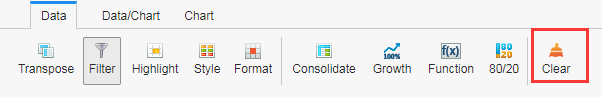
Further processing of data after data research is available on our platform. These features of processing functions are to transpose table, to filter data, to highlight display, to style data, to consolidate, to calculate growth, to customize function, etc., so that a variety of users’ needs might be met.
I. Transpose Table
In data table view, you may transpose the columns and rows of the data table (chart) by clicking “Transpose”. Besides, data transposal is also available with a simple dragging of the dimensions to switch or rearrange their position. Other different table styles can also be transformed.
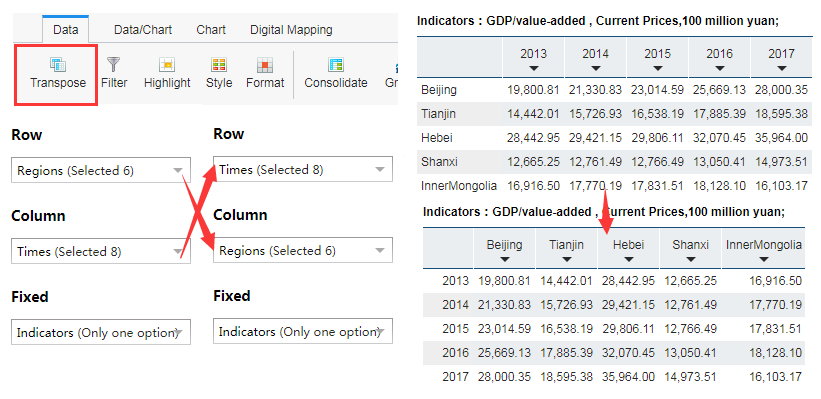
Note: Only one indicator of dimensions can be selected for the fixed area. Once selected, the indicator shall be displayed on the top of the table.
II. Filter Data
Data shall be filtered with the application of “Filter”. With a click on the icon, the filtering window shall pop up. There are two common filter conditions, hide zero cells and hide blank cells, and by checking the boxes and clicking Apply, the data filtering is carried out.
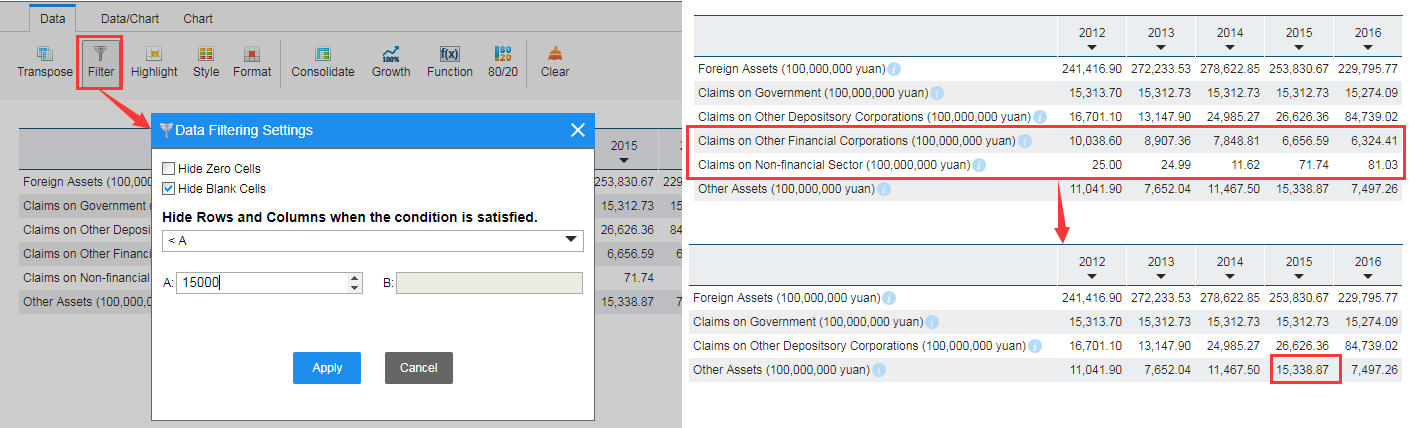
In addition, you can also customize the filter conditions at the bottom of the window. It is noted that the row or column will not be hidden when it contains a figure unqualified.
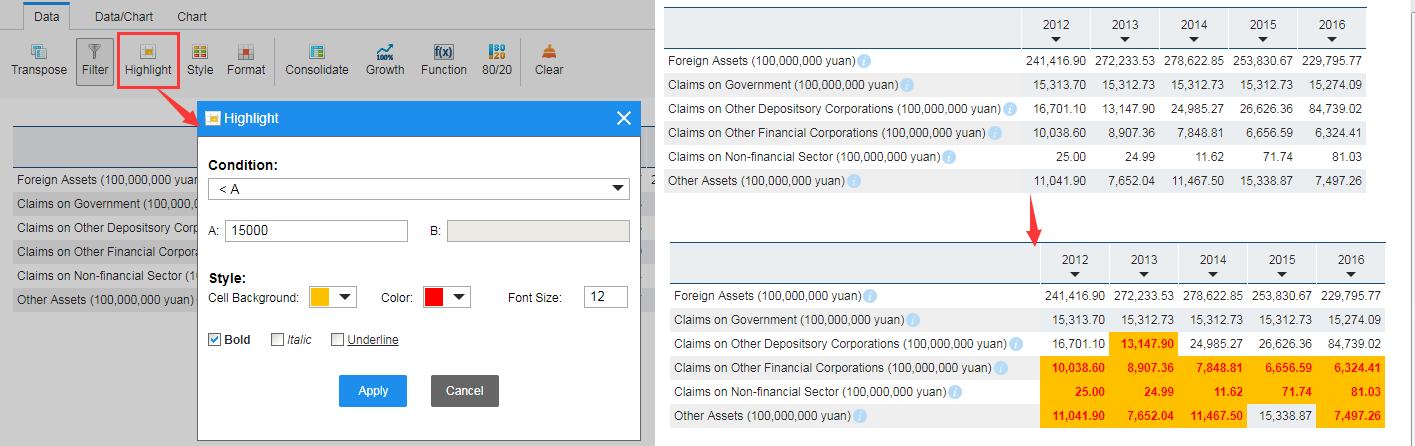
III. Highlight
When it comes to the situation where you need to observe certain specific data among a mass of data, you could apply our Highlight to stand out these data with different cell background, color and font size, so that these data would be prone to being recognized. For highlight setting, you may enter corresponding parameters in the message box before applying this function.
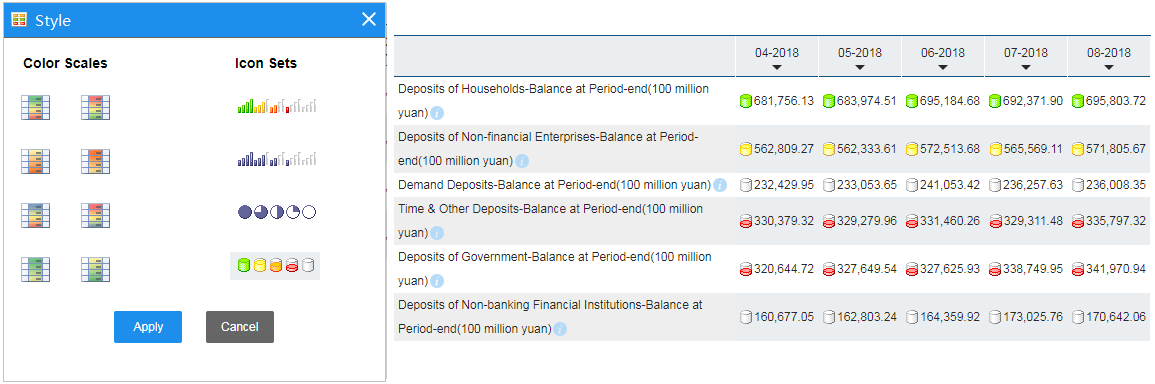
IV. Style
When the search results are too many, you may apply our Style function to differentiate data value by way of color scales and icon sets. With such application, you may find it easier and more visual to observe the data and acquire data characteristics. On this platform, we provide four color scales and four icon sets for you.
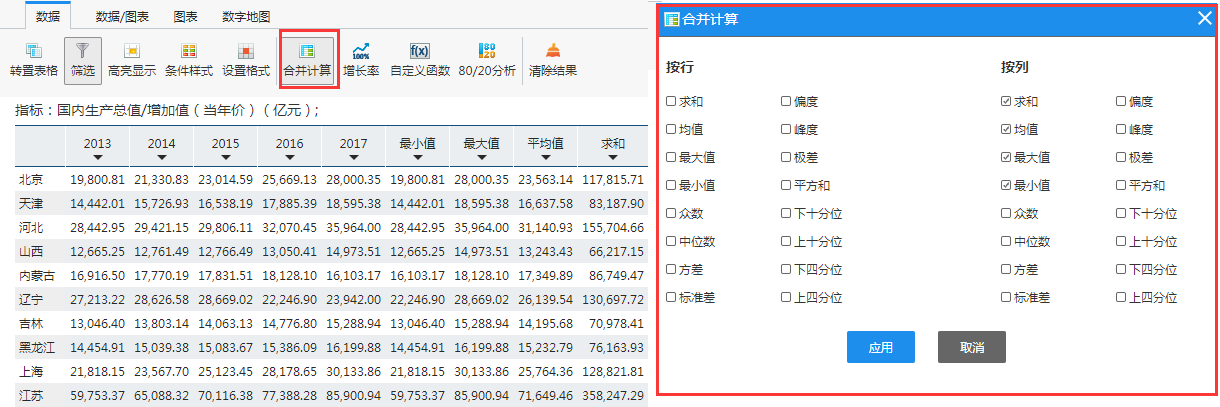
V. Consolidate
Common calculation functions are also available on our platform. You may apply such calculations on line, which for sure would save your time and enhance your efficiency to work out data.
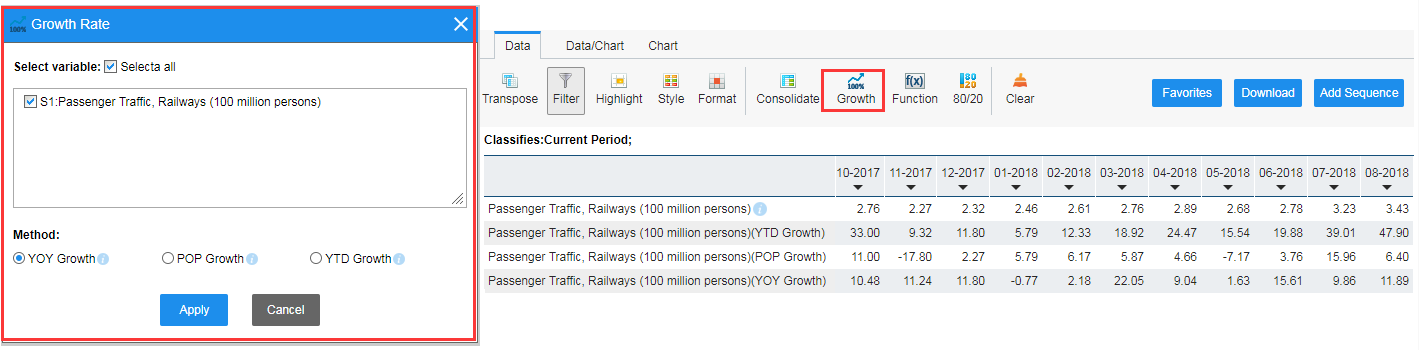
VI. Growth Rate
With the application of Growth, the growth rates (YOY growth, POP growth or YTD growth) among series of data shall be calculated. For quarterly and monthly data, the YTD growth is acquired by the expression (X[current] – X [end of last December or last quarter four])*100/ X [end of last quarter four].
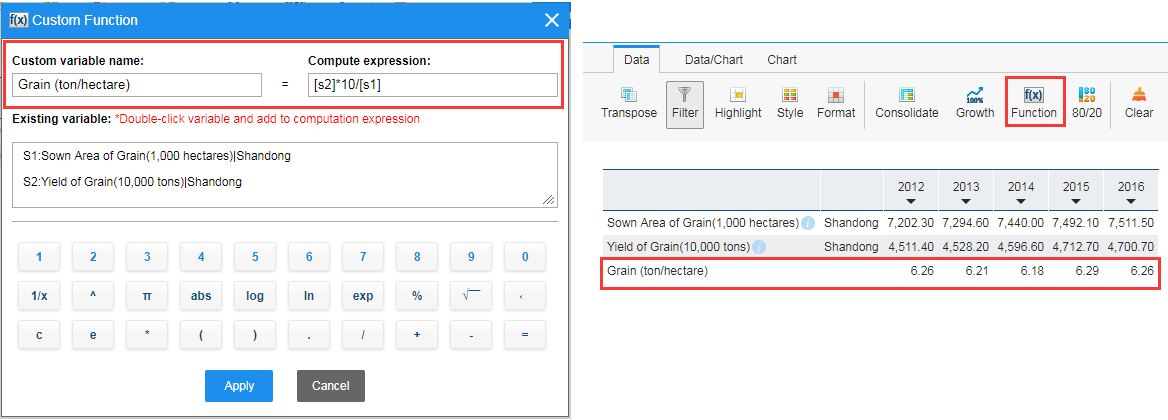
VII. Customize Functions
Function customization may be applied when it comes to complicated calculation of sequences. By customizing functions, these sequences could be computed to do addition, subtraction, multiplication, division, reciprocal, power, absolute value, logarithm, remainder, etc. Take the example of calculating the per unit output of grain crops in Shandong Province, which could be obtained to divide the total output of grian crops by their sown area. For this case, you may select or enter variables and calculation symbols and add to compute expression, and with a click on Apply the result is at hand.
VIII. 80/20 Analysis Parameter
The 80/20 Analysis Parameter here is a method for data analysis based on the 80/20 rule of Italian economist Pareto. With this application, you can get 80% important selected data and the 20% less important data, and easily understand which field or region the important 80% factors come from in your economic research, energy research or management research. Therefore, this function works as data support for decision-makers.
Take the example of conducting 80/20 analysis on the data of Rural Employment of Private Enterprises in 31 Provinces and Cities of 2011-2015. An analysis result is easily arrived by a simple click on the icon. Besides, you can also set the font size and color of certain columns in the message box.
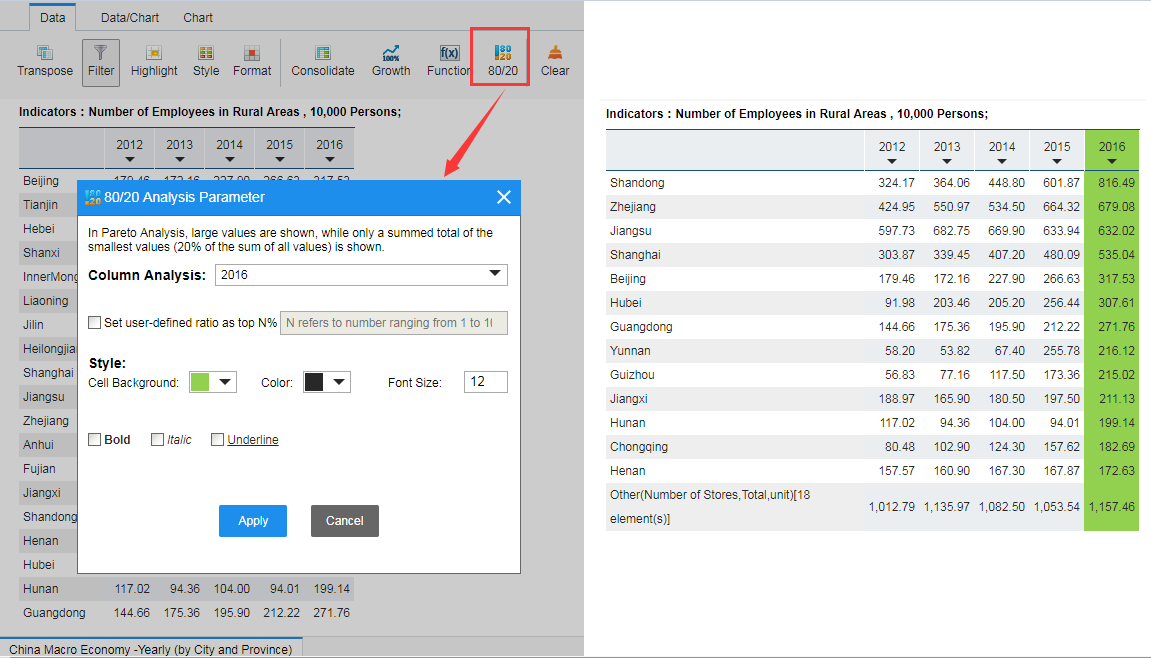
For this example, 80/20 Analysis is carried out for data 2016: with descending sort, the top 80% results are demonstrated in regular fashion, while the bottom 20% demonstrated as a whole. It can be seen from the analysis result that, top one rural employment in private enterprises is in Shandong Province, and the employment of 13 provinces including Shandong, Zhejiang, Jiangsu takes top 80% of the total, and that of the rest 18 provinces takes the other 20%. With such application, it becomes easier to figure out provinces with most rural employment, saving your time to observe the provinces one by one. Accordingly such conclusion could be drawn that the overwhelming majority of rural employment incorporated into private enterprises are from the provincial divisions in eastern China, which are also more developed in terms of private economy. By further comparison with state-owned enterprises and collective enterprises, it may be proposed that, to increase rural employment, private economy needs to be enhanced.
In addition, user-defined ratio of the analysis parameters is incorporated in our EPS China Data Version 2.0 to meet different requirements of our users.
On the other hand, if such result is not needed, you can also remove it by a click on “Clear”.
Previous Guide: Introduction
Next Guide: Visualization