User Guide
Part III Data Visualization
To make our data more visual and vivid, a variety of charts and digital mapping are incorporated. You may choose and apply these that best suit you.
I. Chart Visualization
11 charts are available on our platform for your selection. For chart, the system default takes all information of a table in the fashion of column. Besides, you may click certain years or regions on the table to demonstrate them especially, or you may click some data point which shall be displayed in column.
Take the example of comparing the GDP per capita between Beijing, Tianjin and Hebei. After the application of Search and click on Data/Chart, you may find the column demonstration of GDP per capita 2008-2017 of Beijing, Tianjin and Hebei, and by the column it becomes obvious that the GDP per capita 2008-2017 of Beijing and Tianjin is much higher than that of Heibei.
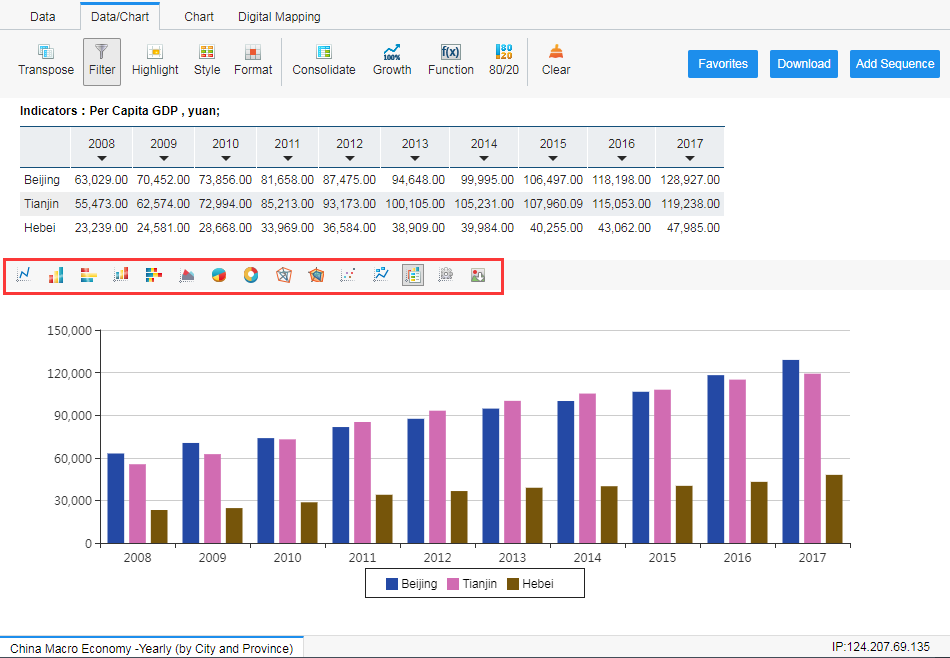
Besides, you can also add data labels and legend on this chart.
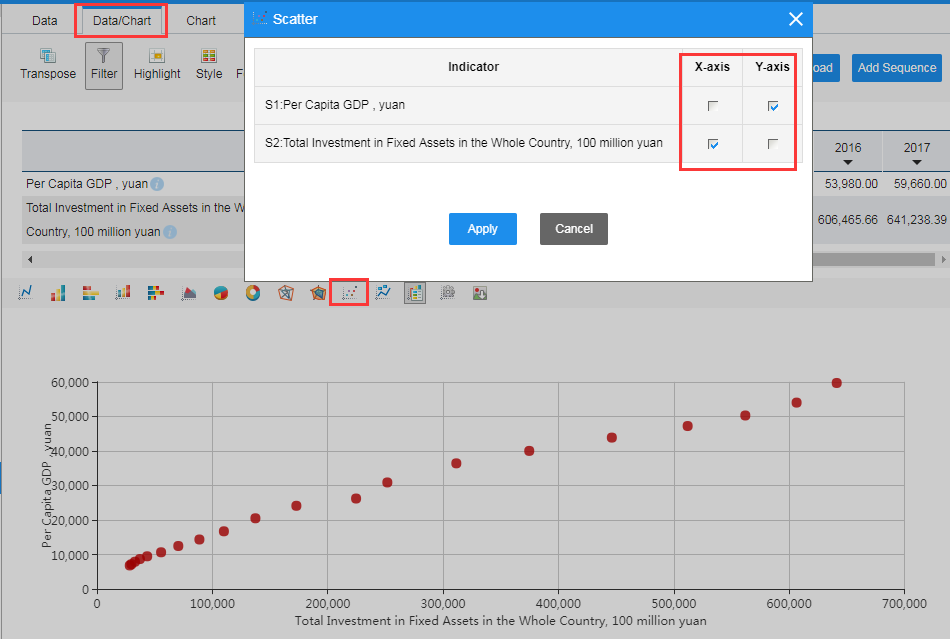
In addition, if you intend to figure out the relation between two indicators, you may apply Scatter. What you need to do here is to decide the X-axis and Y-axis and click on Apply.
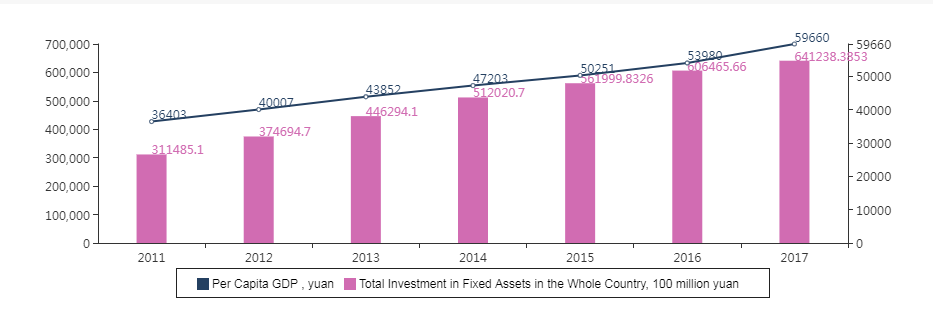
In the meanwhile, for all our charts, you may customize them by “Customize Chart” click. In terms of chart type, “Mixed Chart” is further included, and column and line charts might be also plotted on the secondary axis. Moreover, setting of background color, gridlines, scale of coordinate axis, legend, etc. is also available.

You can also download the charts if needed by a click on Download. For data demonstration, you may alternate between data/chart and chart to achieve a better observation that suits you.
II. Digital Mapping
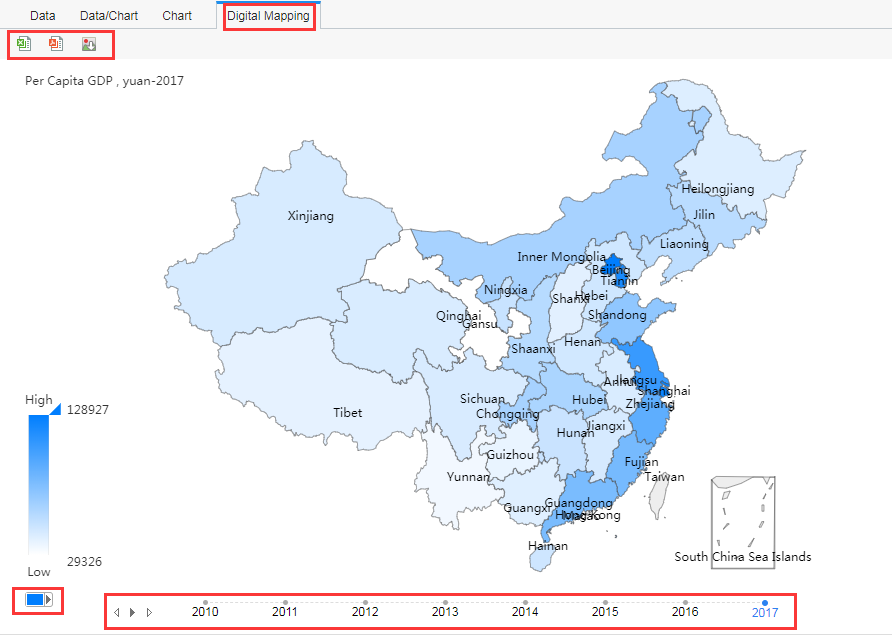
Digital mapping is an illustrative way to help you observe data change nationwide or worldwide, along with the change of colors marked on different regions. For digital mapping, after the selection of regions and indicators, you may click on Digital Mapping and observe such data. Further, you may acquire the maps of certain years by the selection of time series at the bottom of the page, or get dynamic maps by a click on “Play/Pause” button. Download of digital mapping is also available, with three formats of Excel, PDF and JPG.
Previous Guide: Features
Next Guide: Analysis and Prediction